
LIFE CYCLE ASSESSMENT: NEW PERSPECTIVES ON ENERGY SOURCES
One of the indicators used to assess the impact of human activities, such as electricity production, is the amount of greenhouse gases emitted into the atmosphere. While this is accurate, it represents only a part—although a crucial one—of the environmental impact that electricity production, still significantly reliant on fossil fuels today, can have. A more comprehensive and sophisticated evaluation can be conducted by analyzing the entire life cycle of a technology or an energy supply chain, using the Life Cycle Assessment (LCA) approach. The environmental impacts of electricity production are indeed diverse and multifaceted, encompassing land use, exploitation of water and mineral resources, and human toxicity, among the others.
The LCA Method and UNECE
Life Cycle Assessment (LCA) is a tool based on the comprehensive accounting of environmental flows associated with a production system. Defined as “cradle-to-grave,” LCA considers the entire life cycle of the system, ensuring the assessment of all material, energy, waste, and emission flows from raw material extraction to final disposal. The completeness and reliability of LCA have made it one of the primary tools underpinning European policy on sustainable resource use.
Recognizing the urgency of developing efficient energy policies aligned with a climate-neutral path, the United Nations Economic Commission for Europe (UNECE) has undertaken an in-depth study to identify and quantify the environmental impacts of various electricity production technologies in UNECE regions. The results of these assessments are outlined in the report “Carbon Neutrality in the UNECE Region: Integrated Life Cycle Assessment of Electricity Sources” and are of particular interest.
Results – Greenhouse gases emission
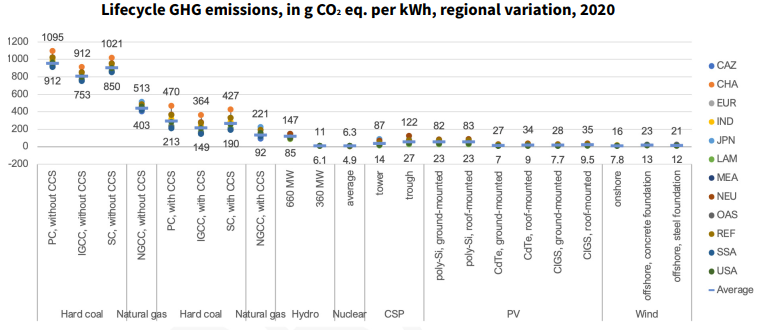
Figure 1 – Greenhouse Gas Emissions in grams of CO2 equivalent per electric kWh produced, as of 2020.
*The legend indicates various geographical areas: Canada, Australia, and New Zealand; China; European Union; India; Japan; Latin America; Middle East and North Africa; Other Asia; Extra-EU States; Former Soviet Union; Sub-Saharan Africa; United States of America.
Source: UNECE – Carbon Neutrality in the UNECE Region: Integrated Life Cycle Assessment of Electricity Sources
Figure 1 illustrates the equivalent CO2 emissions per kWh of electricity produced from various energy sources: coal and natural gas (without and with carbon capture on-site), hydroelectric, nuclear, concentrated solar, photovoltaic solar, and wind. Some points of interest emerge clearly:
- Regional variability in emissions: This is evident in subsequent figures as well. The geographical location where a technology is employed significantly influences atmospheric emissions. Different nations present a unique mix of electricity production, fossil fuel extraction/refinement/importation chains, and the availability of renewable resources.
- Greenhouse gas emissions from renewable sources: It’s important to note that even renewable sources emit greenhouse gases when considering the entire life cycle of the plant. For example, a functioning photovoltaic panel does not emit greenhouse gases, but the production, raw material extraction, and end-of-life disposal have significant emission impacts.
- Highest specific emissions: Coal and natural gas continue to be the main emitters. However, the use of Carbon Capture and Storage (CCS) technologies can significantly reduce this impact. In some cases, a concentrated solar power plant could emit more greenhouse gases than a natural gas plant with CCS, especially in countries with limited solar resources.
- Differences in emissions within the same energy sources: The specific technology used has a significant impact on emissions. For instance, a polycrystalline silicon photovoltaic system may emit about four times more than a cadmium-telluride system. Additionally, hydroelectric plants with an installed capacity of 660 MW or higher have an environmental impact more than ten times greater than plants of 360 MW or smaller size.
Results – Land Use, Raw Materials and Water Consumption
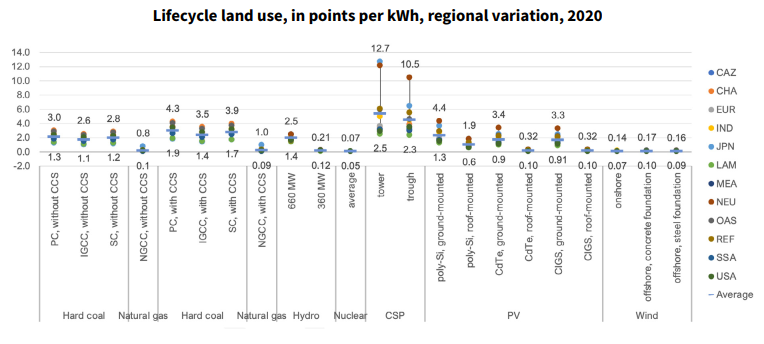
Figure 2 – Normalized Indicator of Land Consumption per Electric kWh Produced, as of 2020
*The legend indicates various geographical areas: Canada, Australia, and New Zealand; China; European Union; India; Japan; Latin America; Middle East and North Africa; Other Asia; Extra-EU States; Former Soviet Union; Sub-Saharan Africa; United States of America.
Source: UNECE – Carbon Neutrality in the UNECE Region: Integrated Life Cycle Assessment of Electricity Sources
Figure 2, illustrating a normalized parameter indicative of the area required to produce one electric kWh for various technologies under study, highlights two aspects of interest:
- For fossil sources, land occupation is more influenced by the extraction of the necessary fuel or raw materials. In the case of renewable sources, on the other hand, land occupation during the plant’s operation plays a dominant role.
- Considering the entire life cycle of the system in terms of land occupation, renewable sources show a similar, if not worse, impact compared to fossil sources. In contrast, nuclear energy appears to be the most sustainable solution from this perspective, followed by wind and gas.
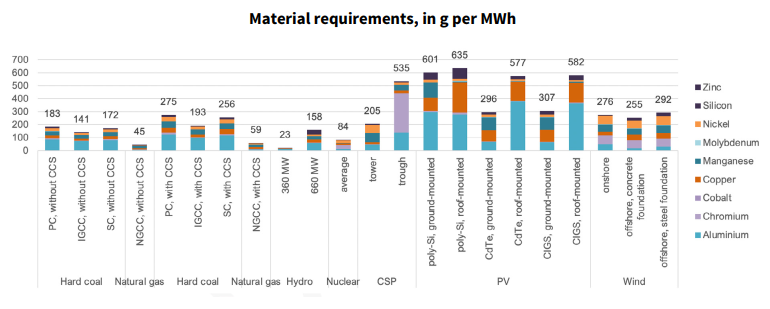
Figure 3 – Grams of Raw Materials Required to Produce One MWh of Electricity, as of 2020
Source: UNECE – Carbon Neutrality in the UNECE Region: Integrated Life Cycle Assessment of Electricity Sources
Analyzing raw materials, Figure 3 shows the materials required by different technologies to produce one electric MWh. Once again, some surprising elements emerge:
- Solar sources appear to have the highest impact on the planet, both in photovoltaic and concentrated versions, followed by wind and coal with on-site carbon capture. This can be explained by considering the significant amount of copper needed for electrical connections and inverters, as well as aluminum (which can be easily recycled) essential for photovoltaic support frames, and chromium required by concentrated solar for the production of stainless steel structures.
- Among the less impactful sources in terms of required materials, we find hydroelectric with a maximum power of 360 MW, natural gas (both with and without CCS), and nuclear energy.
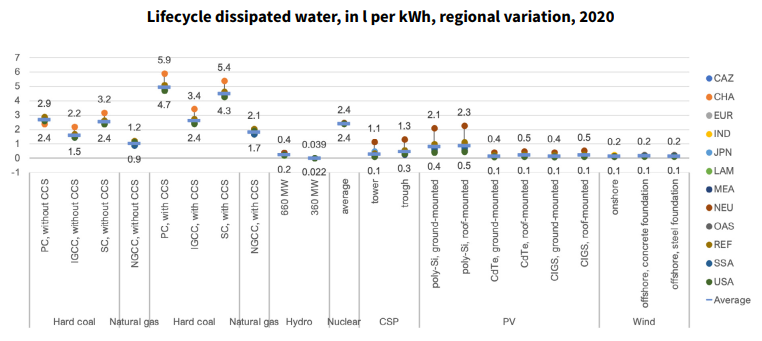
Figure 4 – Liters of Water Required to Produce One kWh of Electricity, as of 2020
Source: UNECE – Carbon Neutrality in the UNECE Region: Integrated Life Cycle Assessment of Electricity Sources
A natural resource increasingly limited with the evolution of climate change is water. Figure 4 illustrates the liters of water required by each technology to produce one kWh of electricity. In this case, the data highlight a marked difference between renewable sources and fuel-based thermal plants. Renewable sources require significantly less water compared to thermal systems, with coal (with and without CCS) being more impactful on water resources than any other source, followed by nuclear and carbon capture gas. However, there is an exception: polycrystalline silicon photovoltaics, due to the water input required for the production of photovoltaic cells, require much more water than other renewable sources, reaching quantities comparable to nuclear and gas.
Impacts on ecosystems

Figure 5 – Normalized Indicator of Ecosystem Impacts for Various Technologies (excluding climate change) to Produce One MWh of Electricity, as of 2020
*The legend indicates various impacts: Terrestrial Ecotoxicity; Natural Land Transformation; Marine Ecotoxicity; Freshwater Eutrophication; Freshwater Ecotoxicity; Agricultural Land Occupation; Urban Land Occupation; Terrestrial Acidification.
Source: UNECE – Carbon Neutrality in the UNECE Region: Integrated Life Cycle Assessment of Electricity Sources
Figure 5 represents the impacts of each technology on ecosystems for every MWh of electricity produced, temporarily excluding climate change. The components of these impacts are diverse and include land occupation, increased ecotoxicity of natural elements, and their eutrophication. It is noteworthy that, excluding climate change, land occupation is the most significant environmental impact of electricity production, and specifically, coal is by far the most impactful source on ecosystems.
Among other sources, nuclear appears to be the least impactful, mainly due to the high energy density of the fuel, followed by wind, natural gas, and photovoltaic solar. However, both concentrated solar and photovoltaic systems show high impacts, primarily due to the low energy density of the solar source and, consequently, the extensive land areas required to produce significant amounts of electricity.
Overall Assessment
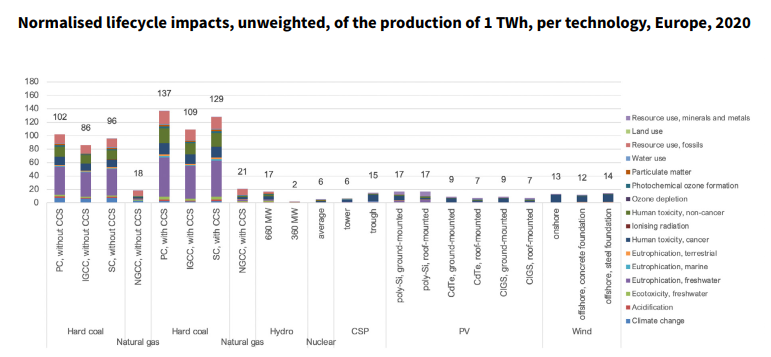
Figure 6 – Normalized Indicator of the Overall Impacts of Technologies to Produce One TWh of Electricity, as of 2020, in Europe
*The legend indicates various impacts: Mineral and Metal Resources; Soil; Fossil Fuels; Water; Particulate Matter; Photochemical Ozone Formation; Ozone Depletion; Non-carcinogenic Human Toxicity; Ionizing Radiation; Carcinogenic Human Toxicity; Terrestrial, Marine, Freshwater Eutrophication; Ecotoxicity; Acidification; Climate Change.
Source: UNECE – Carbon Neutrality in the UNECE Region: Integrated Life Cycle Assessment of Electricity Sources
Finally, in Figure 6, a summary of all the assessments conducted in the UNECE study is presented. The result is a normalized indicator of the overall impacts caused by the production of 1 TWh of electricity in Europe, considering effects on the environment, human health, and the use of natural resources. The normalizations (Figure 5 and Figure 6) of the indicators are calculated by multiplying each component by a coefficient inversely proportional to the corresponding environmental impact of an average individual. For example, if an average European has a greenhouse gas footprint of about 10 tons of CO2 eq./year, the emission of 1 ton of CO2 eq. will be normalized to 1/10 = 0.1.
It is evident that the source with the greatest impact is coal, especially with CCS (Carbon Capture and Storage), mainly due to freshwater eutrophication resulting from the use of phosphorus compounds during fuel extraction, which are subsequently released into the water. Following are natural gas and renewable sources. In the case of renewables, the most impactful components are toxicity to humans and the use of metals and minerals. Sources that show a reduced environmental impact are hydroelectric with a power of 360 MW or less and nuclear energy.
Wrapping up
The complexity of the environmental crisis requires a variety of responses and cannot be addressed by focusing exclusively on a single technological solution. Considering this and the current strong push for electrifying consumption as a fundamental step toward decarbonizing production systems, studies like the one conducted by UNECE play an essential role in providing assessment elements on which energy sources are more sustainable and secure.The perspective of Life Cycle Assessment (LCA) is also crucial, as it allows for a comprehensive evaluation of the impacts of each solution, covering the entire spectrum from raw material extraction to plant decommissioning. Through this meticulous approach, important peculiarities can be highlighted, such as the sustainability of nuclear energy, the significant consumption of limited natural resources (minerals and metals) resulting from the manufacturing of renewable energy facilities, or the extremely high environmental and social impact of fossil sources, even net of greenhouse gas emissions.
Article by, Valentino Attanasio Italian Climate Network Volunteer